Cosmo Varah-Sikes
University of Maryland
Experimental and Remote Study of the Spinel-Rich Sinus Aestuum Pyroclastic Deposits
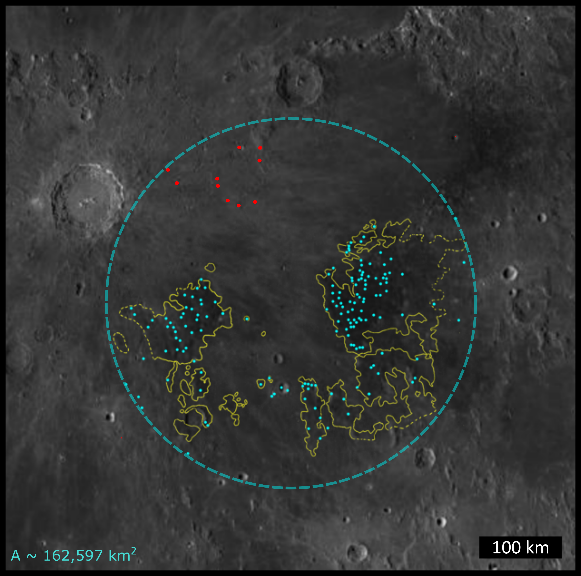
The Sinus Aestuum (SA) Dark Mantle Deposit (DMD) is a pyroclastic deposit on the nearside of the moon which displays spectral signatures observed nowhere else on the lunar surface. Although these signatures suggest high abundances of spinel to be present within the DMD, limitations of terrestrial spinel spectral analogues leave the composition and formational mechanism of the SA spinel uncertain. Estimating the possible extent of spinel signatures in the region suggests the SA DMD likely extends much further north than previously thought. The detection of additional spinel-rich deposits in this northern region suggests that these deposits represent the northern extent of the SA DMD.
Equilibrium melting experiments performed by previous studies show that spinel ranging from chromite (FeCr2O4) to ulvöspinel (Fe2TiO4) may form from picritic melts associated with DMDs under certain conditions. Although similarities between Ti-Cr spinel spectra and SA spinel spectra would suggest the SA spinels crystallized directly from picritic melts, current spectral data from Ti-Cr spinels is very limited. To account for this, we plan to synthesize various Ti-Cr spinels using a 1 atm gas mixing furnace and measure their spectra to compare to SA. If a match is observed, we will perform our own set of equilibrium experiments on picritic melts to identify the conditions most favorable to spinel production. If the SA spinel spectra are inconsistent with Ti-Cr spinel spectra we will investigate other potential spinel compositions and formational mechanisms. Fe-Al spinel has been hypothesized to be present at SA and may form via the interaction of anorthitic lunar crust and picritic melts prior to eruption. Spinels produced via assimilation experiments between picritic melts and anorthite capsules will be measured spectrally and compared to SA to potentially link this composition and origin.